I don't know about you, but I enjoy the drama of watching an episode of Hells Kitchen just to see that infamous celebrity chef lose his cool and throw a plate full of food at his up-and-coming potential protégés.
But let's be real here: drama can stay where it belongs, which is on the TV and not in Xplan. So why let Xplan “data drama” bog us down?
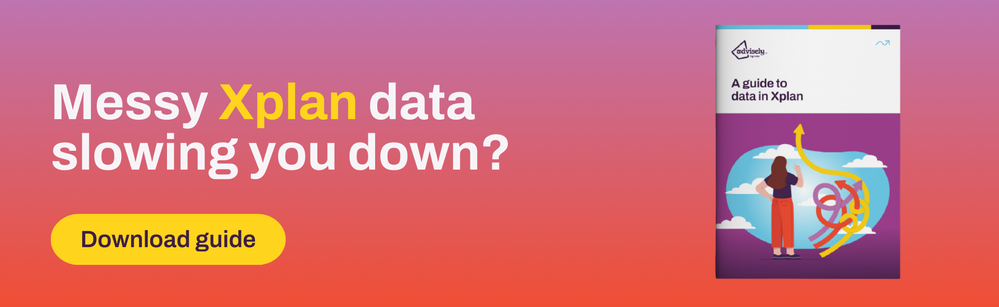
All too many times, we’ve seen and heard the difficulties you can face when it comes to accessing and reading data within Xplan. Things like data being in a messy format, tables containing too much useless detail and not enough substance and reports that are just full of numbers that, after a while, just look like hieroglyphics.
In this article, we will look at using XBI and reporting like a head chef at the pass, where you need to inspect every "plate" of data before it goes out to ensure quality, manage costs and monitor feedback.
Look, feel and taste
These three key rules – look, feel and taste – can also apply to Xplan reporting. Let’s take a look at the fundamentals of these rules.
1: Does it look appetising?
Nobody likes a messy plate of food. Similarly, with Xplan Business Intelligence, you need to ensure that you have a clean dashboard – one that is visually appealing and doesn't take long to understand what is presented.
Having too much all thrown together on one screen can also be a nightmare to navigate, so keep it simple, keep it clean, but most importantly keep it relevant.
2: Feel
We’re not talking about whether the data is hot or cold, but whether the data is tangible. Is it useful? Or are you gathering data just for the sake of it?
Being able to identify what is crucial data versus what is non-crucial data to report on is important when planning out your dashboards and reports.
3: Taste
Easily digestible data is key. Can it be used elsewhere with other data? Does the result contain all the information that you are expecting? And finally, is the report easy for management to gain knowledge at a glance and answer questions that they have?
Food for thought
Whether you’re building a new set of reporting tools or reviewing what you currently have, you need to ensure that what you have (or end up with) is going to satisfy the hunger for information without leaving you overly stuffed and in a data food coma.
“How do I do this?” you ask. Let's take a step back and analyse this one step at a time.
What are your business’s greatest strengths and weaknesses? List out where you excel and what you know needs improvement. Concentrate on what your business prides itself on and what services you know are your forte.
For example, are you best known for your excellent knowledge in aged care requirements for high net worth couples and individuals?
On the flip side, are you not very admin-focused when it comes to renewing your clients’ ongoing service agreements? And do you sometimes find review dates can lapse before you have a chance to contact your clients to book an appointment?
Not only do you need to be able to identify these, but you also need to be able to pinpoint how this specific data is recorded against your clients.
Finally, what is it that you want to know about these clients? Could it be a specific set of fields that you need to see, or do you want to see how valuable these clients are? (For example, how much FUM do they have or what is the level of adviser fees they pay per annum?)
You might not just want to know their value but also how much time it takes to service them. This could be shown in activity such as the number of contacts you make with them or from how much follow-up work you and your staff do for them.
Once you are clear on all of the above, you can now think about how you would like to see the data and how you’d like it to work. Would the data be more understandable as a table or a chart? Do you want to be able to filter the data or would you prefer to click on a particular element and have it automatically filter down, even right through to a particular client?
From kitchen to table
There are several reporting tools in Xplan that will help you serve up that beautifully-crafted plate of data.
For something simple and quick, Xplan management reports are a set of standard reports that can be run against a list of clients and will instantly provide you with a specific range of data in either a PDF or CSV file. They provide a point-in-time reference and are generally short and quick to merge reports.
For more detailed information, XPORT reporting can provide you with a customer selection of reports that group together similar pieces of information and can be run against a specific list of clients (whether based on adviser, group or a search criteria). XPORT reports can provide either a point-in-time data set or data over a period of time.
These two reporting options can be executed manually or scheduled to run at a specific time – such as overnight, so as to not slow down your site.
Xplan Business Intelligence (XBI) is Iress’s new data analytics product. It will interrogate the information within your Xplan site and provide you with a summary of the most relevant and important insights of your business packaged up in an easy-to-understand visual dashboard.
For more information on XBI, please refer to our previous article, What does the future hold for reporting?
The aperitif before the meal
I hope you’ve enjoyed reading the journey so far from takeaway crew member to becoming a culinary masterchef.
Our next and final article in this series will focus on setting routines to continuously improve your Xplan site. Perfecting that service before it's delivered to your client is like perfecting the dish before it is served.
So get ready for the final order dash, and don't forget to review the wrap-up of the series coming soon. Until the kitchen closes, bon appetit.
 Xplan Expert